Fin Cloud
Critical Financial Cloud Server
Price Cloud
Quotes Feed
Clearing Cloud
Liquidity Clearing System
Trading Central
Automated Investment Analytics
Language
Trading Central
Automated Investment Analytics
With real-time, actionable macro-economic data, Trading Central’s new Economic Calendar provides clients of FinPoints a streamlined tool to enable their investors to easily monitor, anticipate and act on potentially market-moving events. With this service, users of FinPoints' CRM solutions will be able to access a wide range of essential market data curated by Trading Central.

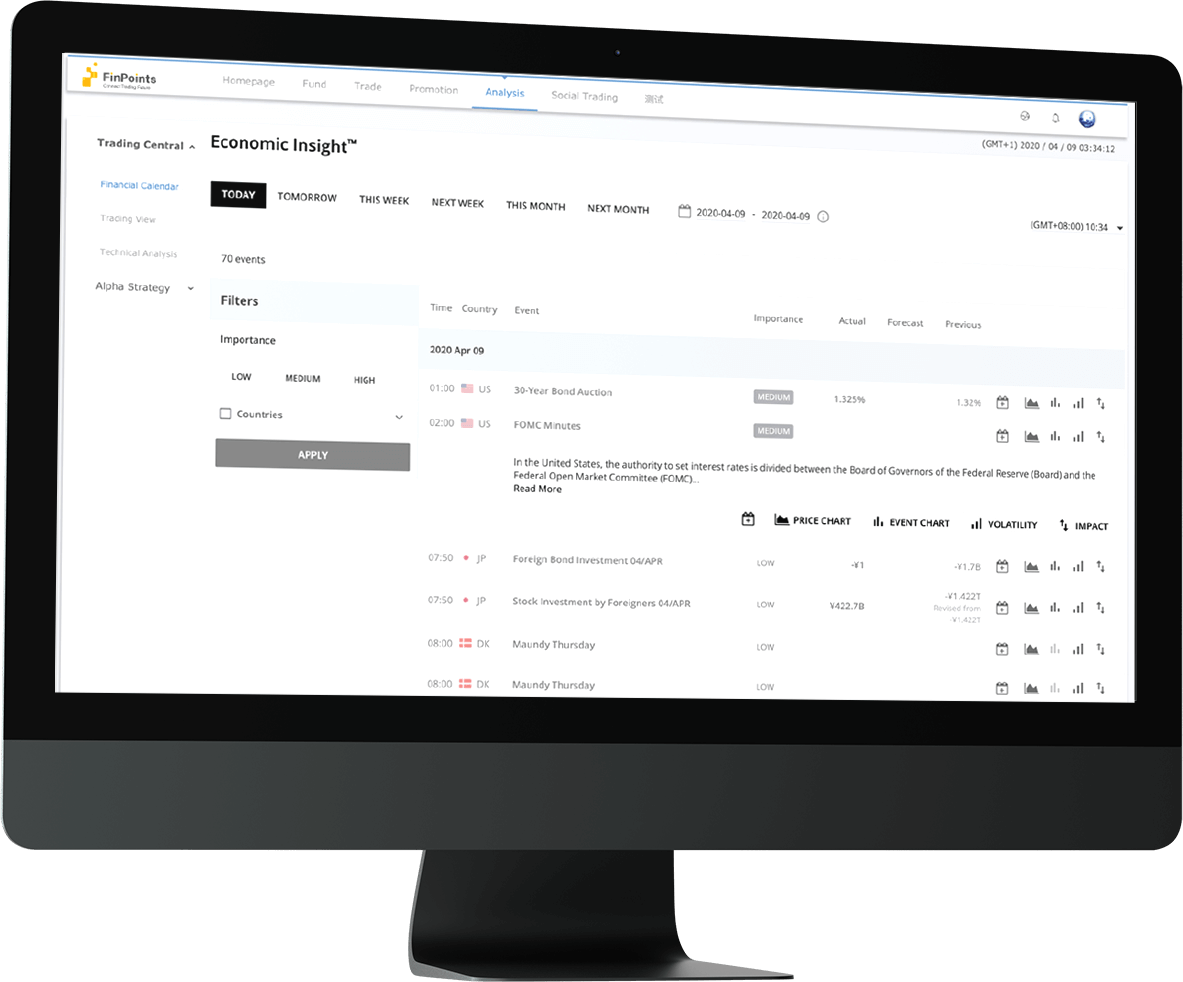
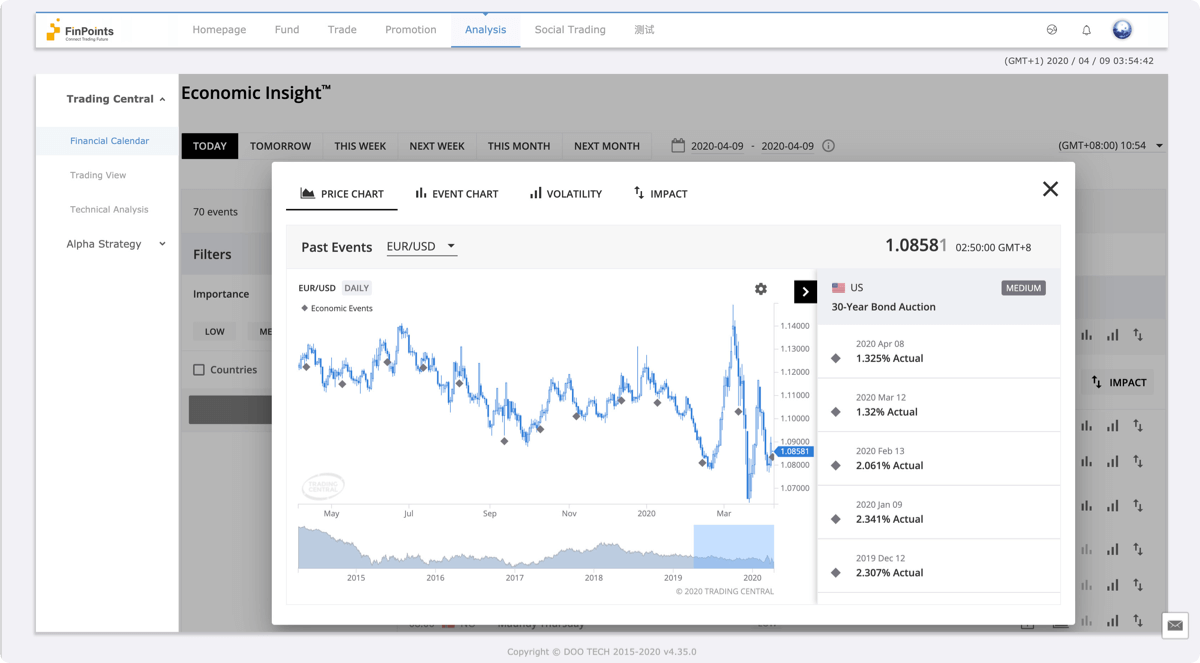
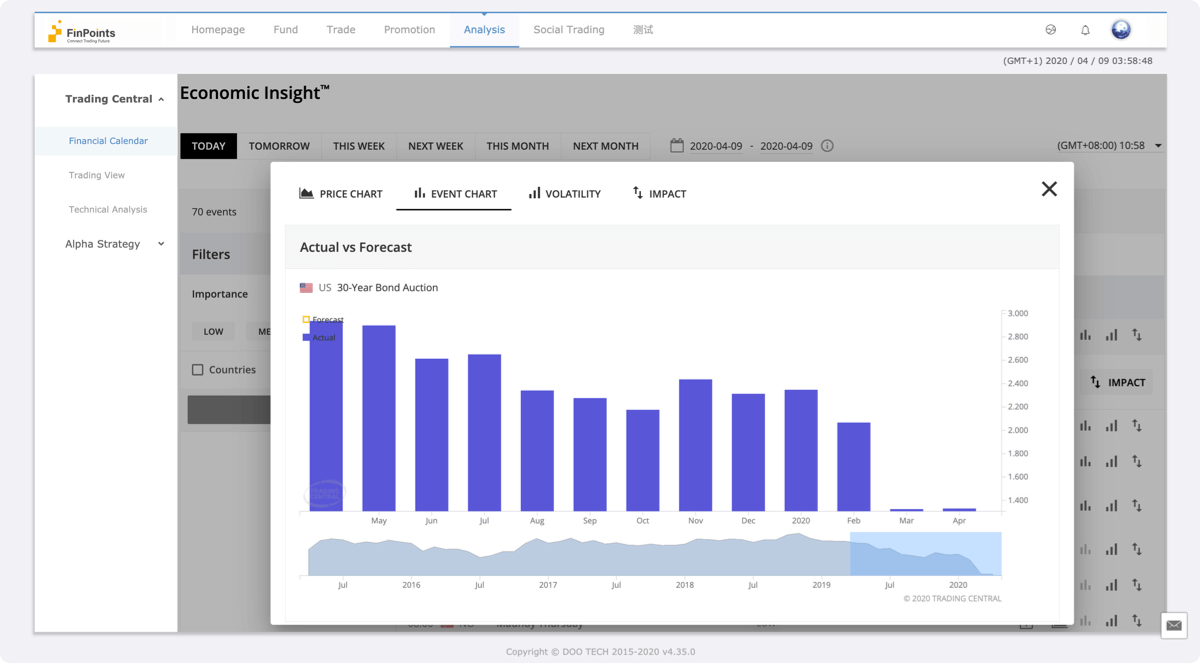
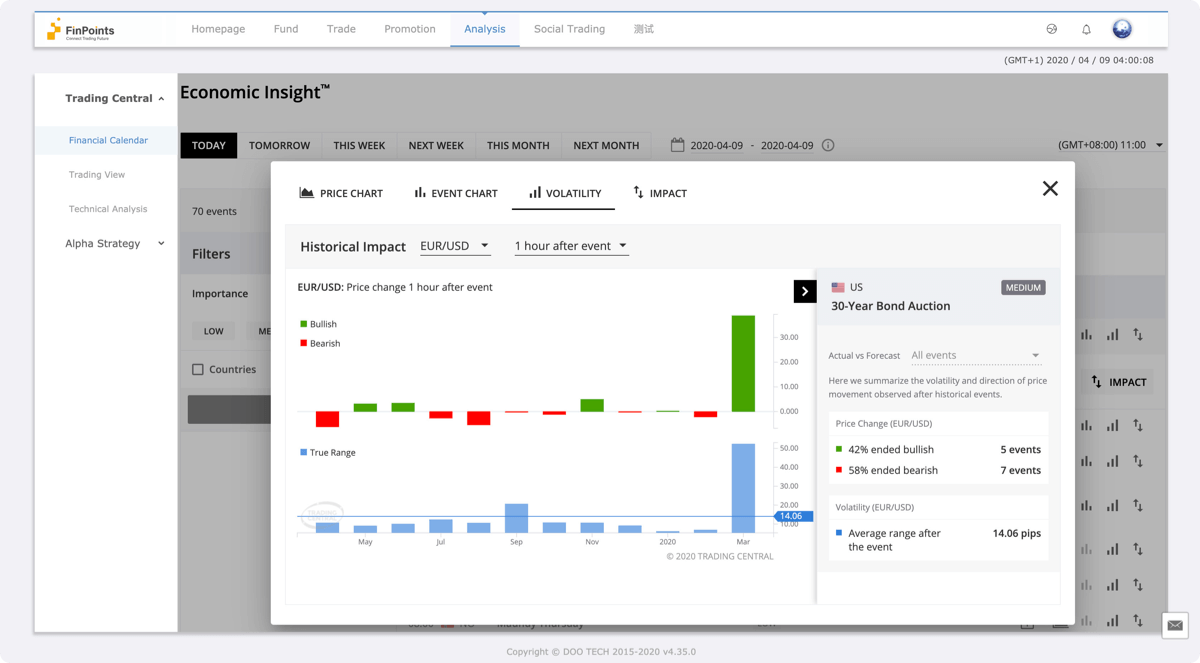
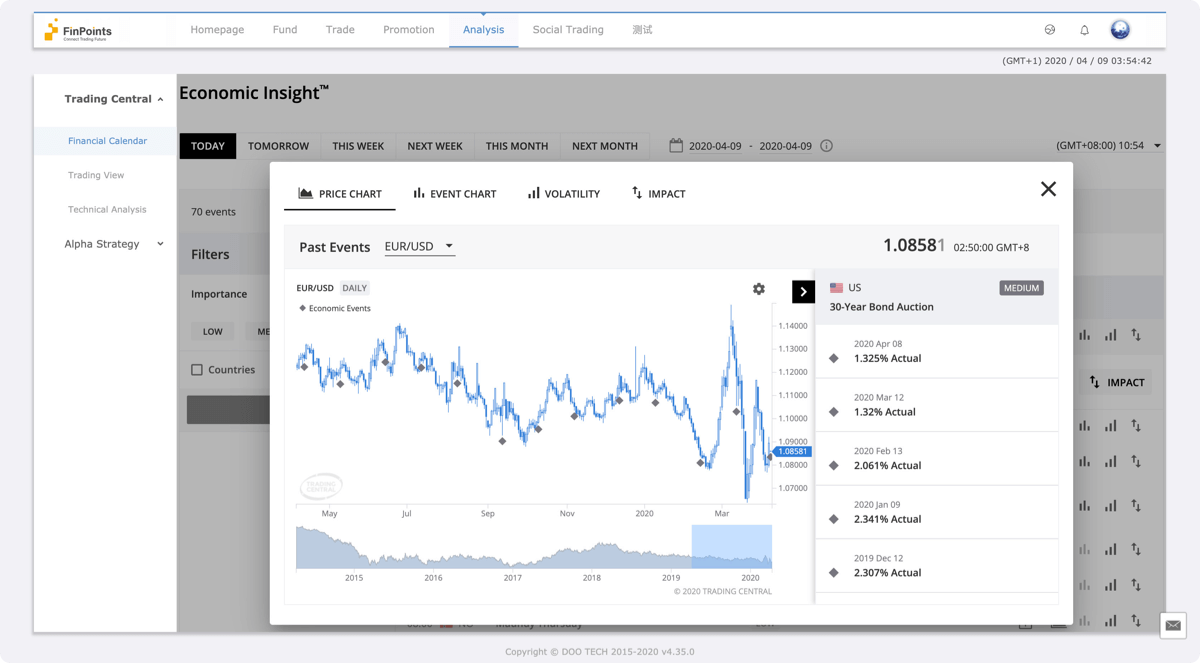
Economic data is the lifeblood of forex trading, and now with FinPoints' TC Economic Calendar, it’s never been easier for online brokers to enable their investors to monitor upcoming events and track the impact it has had on the currency. In addition to the data itself, the presentation of data is equally important and has far-reaching impacts on traders who utilise such information. The charts below provide a few examples of how data is presented on FinPoints' TC Economic Calendar system through different categories, such as the Price Chart, Event Chart and the Volatility and Impact Chart.
The Backbone of the Financial Industry
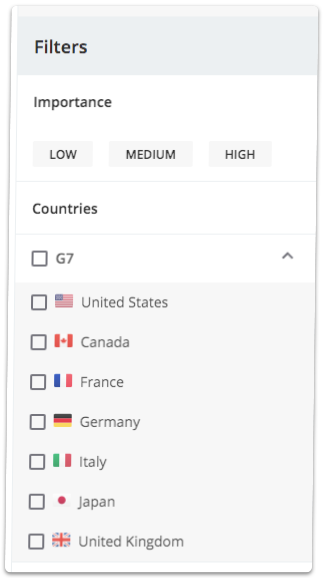
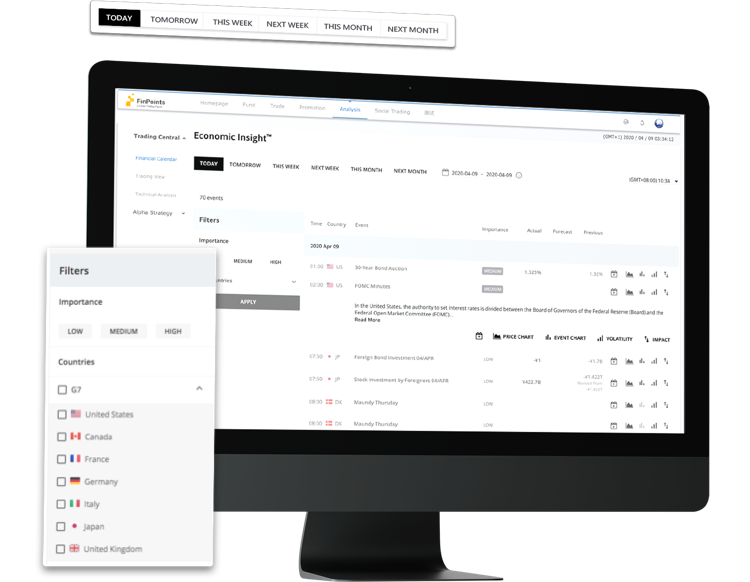
Customisable filters: Traders can focus on what’s important to them by filtering by country or the importance level of an event.
Historical performance: The “forecast” and “actual” values over the last 5 years are plotted out for each economic event, enabling traders to easily discover the historical trend and better understand its influence on the currency.
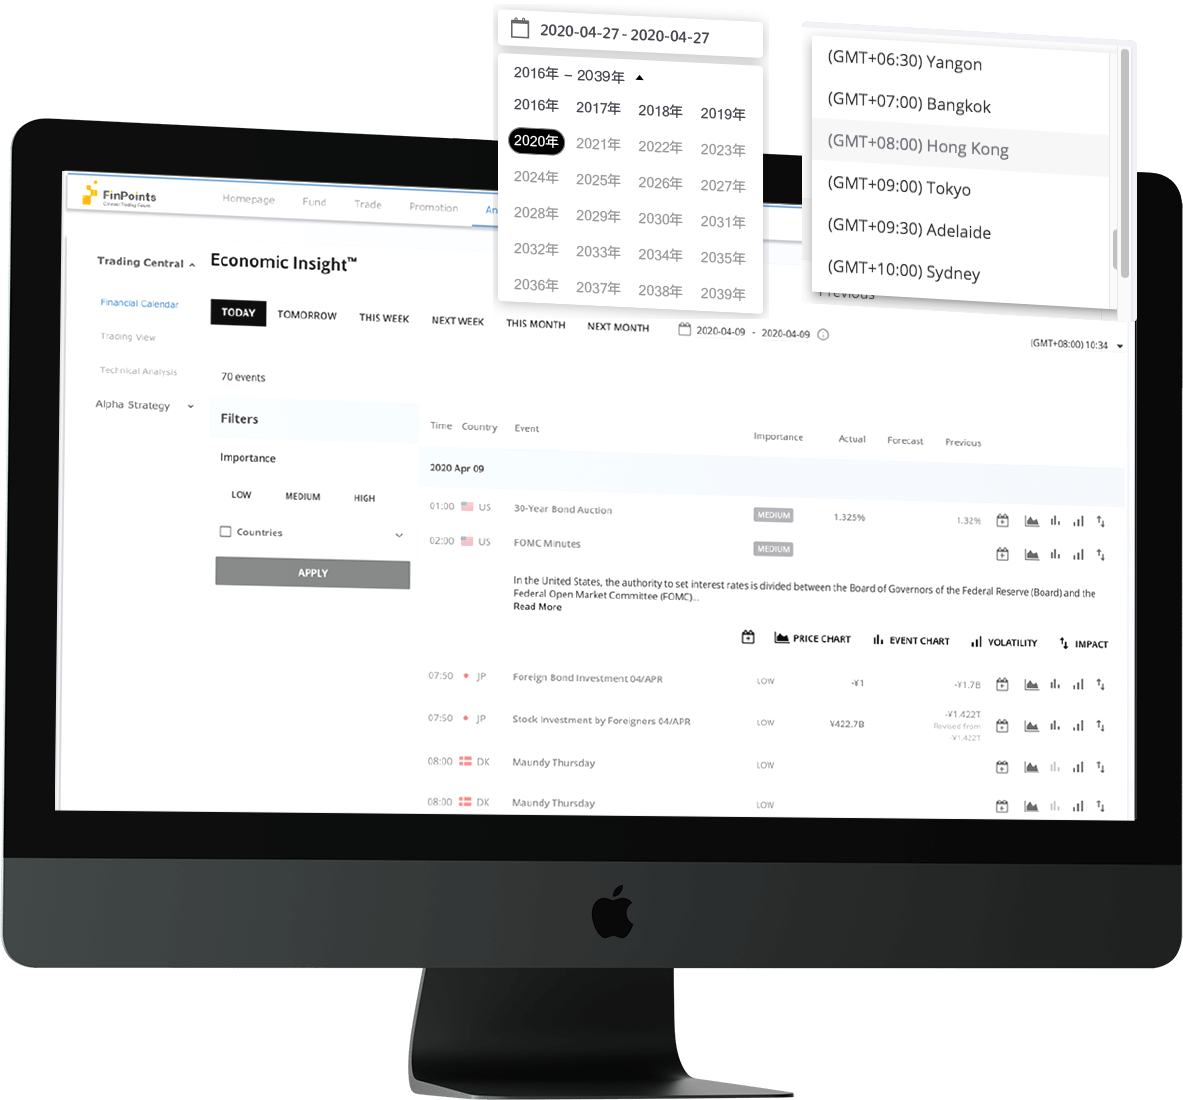
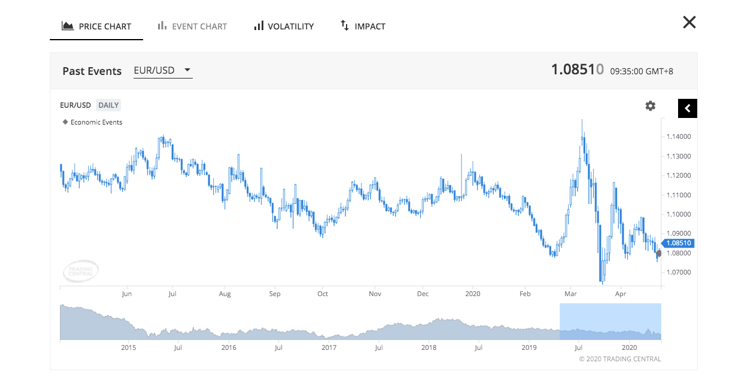
FX Charts tied to Economic Events: With over 115 FX charts mapped to different economic events, traders can easily monitor their pairs through real-time pricing and quickly act if needed.
Real-time data: The macro-economic data is updated in real-time, ensuring your traders are always acting on the most recent data!
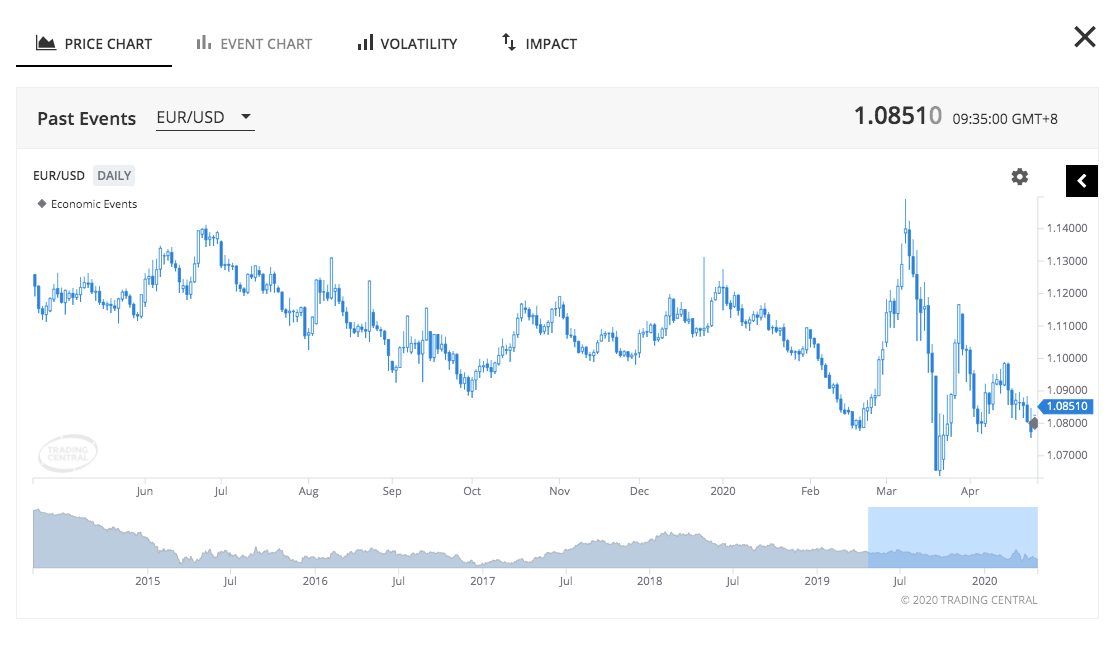
Historical performance
The “forecast” and “actual” values over the last 5 years are plotted out for each economic event, enabling traders to easily discover the historical trend and better understand its influence on the currency.
Customisable filters
Traders can focus on what’s important to them by filtering by country or the importance level of an event.
FX Charts tied to Economic Events
With over 115 FX charts mapped to different economic events, traders can easily monitor their pairs through real-time pricing and quickly act if needed.
Real-time data
The macro-economic data is updated in real-time, ensuring your traders are always acting on the most recent data!